I came to the Silicon Valley region in 2010 because I knew it was the robotics center of the world, but it certainly doesn�t get anywhere near the media attention that some other robotics regions do. In California, robotics...
I came to the Silicon Valley region in 2010 because I knew it was the robotics center of the world, but it certainly doesn�t get anywhere near the media attention that some other robotics regions do. In California, robotics technology is a small fish in a much bigger technology pond, and that tends to conceal how important Californian companies are to the robotics revolution.
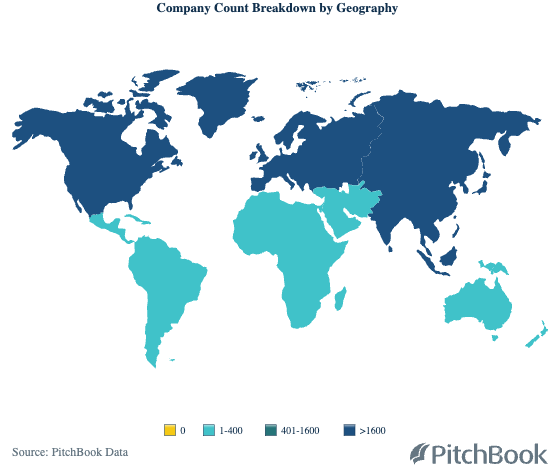
This conservative dataset from Pitchbook�[Vertical: Robotics and Drones]�provides data for 7166 robotics and drones companies, although a more customized search would provide closer to 10,000 robotics companies world wide. Regions ordered by size are:
North America 2802
Asia 2337
Europe 2285
Middle East 321
Oceania 155
South America 111
Africa 63
Central America 13
�
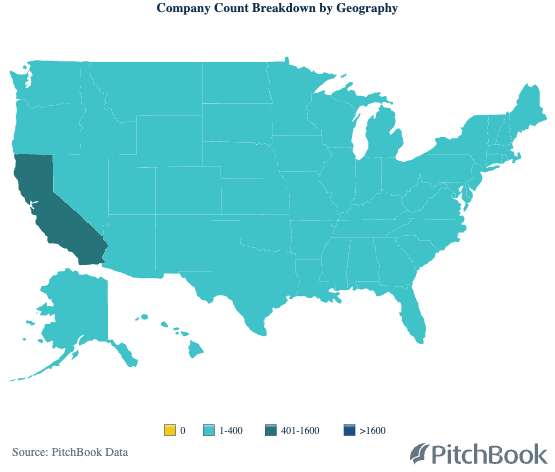
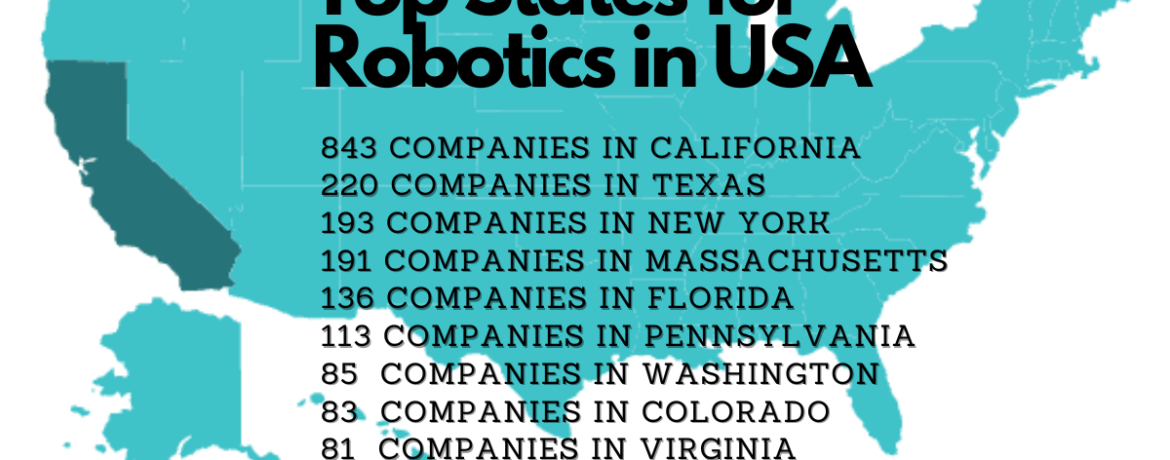
California = 843 (667) * no of companies followed by no of head quarters
Texas = 220 (159)
New York = 193 (121)
Massachusetts = 191 (135)
Florida = 136 (95)
Pennsylvania = 113 (89)
Washington = 85 (61)
Colorado = 83 (57)
Virginia = 81 (61)
Michigan = 70 (56)
Illinois = 66 (43)
Ohio = 65 (56)
Georgia = 64 (46)
New Jersey = 53 (36)
Delaware = 49 (18)
Maryland = 48 (34)
Arizona = 48 (37)
Nevada = 42 (29)
North Carolina = 39 (29)
Minnesota = 31 (25)
Utah = 30 (24)
Indiana = 29 (26)
Oregon = 29 (20)
Connecticut = 27 (22)
DC = 26 (12)
Alabama = 25 (21)
Tennessee = 20 (18)
Iowa = 17 (14)
New Mexico = 17 (15)
Missouri = 17 (16)
Wisconsin = 15 (12)
North Dakota = 14 (8)
South Carolina = 13 (11)
New Hampshire = 13 (12)
Nebraska = 13 (11)
Oklahoma = 10 (8)
Kentucky = 10 (7)
Kansas = 9 (9)
Louisiana = 9 (8)
Rhode Island = 8 (6)
Idaho = 8 (6)
Maine = 5 (5)
Montana = 5 (4)
Wyoming = 5 (3)
Mississippi = 3 (1)
Arkansas = 3 (2)
Alaska = 3 (3)
Hawaii = 2 (1)
West Virginia = 1 (1)
South Dakota = 1 (0)
Note � this number in brackets is for HQ locations, whereas the first number is for all company locations. The end results and rankings are practically the same.
�
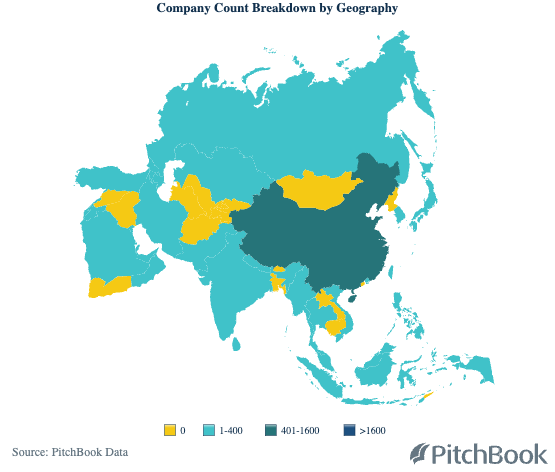
China = 1350
Japan = 283
India = 261
South Korea = 246
Israel = 193
Hong Kong = 72
Russia = 69
United Arab Emirates = 50
Turkey = 48
Malaysia = 35
Taiwan = 21
Saudi Arabia = 19
Thailand = 13
Vietnam = 12
Indonesia = 10
Lebanon = 7
Kazakhstan = 3
Iran = 3
Kuwait = 3
Oman = 3
Qatar = 3
Pakistan = 3
Philippines = 2
Bahrain = 2
Georgia = 2
Sri Lanka = 2
Azerbaijan = 1
Nepal = 1
Armenia = 1
Burma/Myanmar = 1
Countries with no robotics; Yemen, Iraq, Syria, Turkmenistan, Afghanistan, Syria, Jordan, Uzbekistan, Kyrgyzstan, Tajikistan, Bangladesh, Bhutan, Mongolia, Cambodia, Laos, North Korea, East Timor.
�
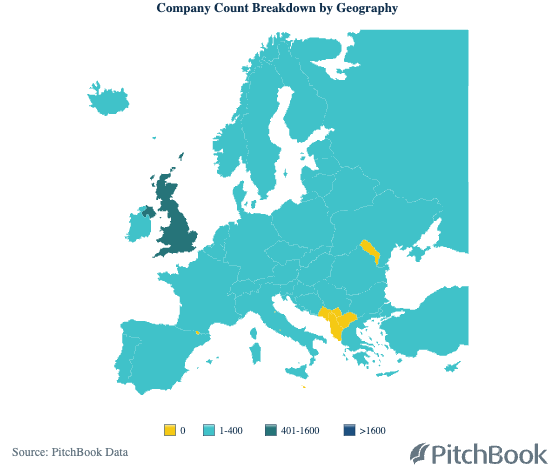
United Kingdom = 443
Germany = 331
France = 320
Spain = 159
Netherlands = 156
Switzerland = 140
Italy = 125
Denmark = 115
Sweden = 85
Norway = 80
Poland = 74
Belgium = 72
Russia = 69
Austria = 51
Turkey = 48
Finland = 45
Portugal = 36
Ireland = 28
Estonia = 24
Ukraine = 22
Czech Republic = 19
Romania = 19
Hungary = 18
Lithuania = 18
Latvia = 15
Greece = 15
Bulgaria = 11
Slovakia = 10
Croatia = 7
Slovenia = 6
Serbia = 6
Belarus = 4
Iceland = 3
Cyprus = 2
Bosnia & Herzegovina = 1
Countries with no robotics; Andorra, Montenegro, Albania, Macedonia, Kosovo, Moldova, Malta, Vatican City.
�
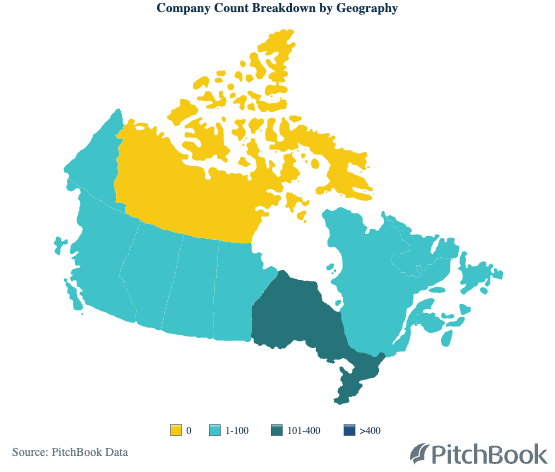
Ontario = 144
British Colombia = 60
Quebec = 53
Alberta = 34
Manitoba = 7
Saskatchewan = 6
Newfoundland & Labrador = 2
Yukon = 1
Regions with no robotics; Nunavut, Northwest Territories.
View Entire Post