

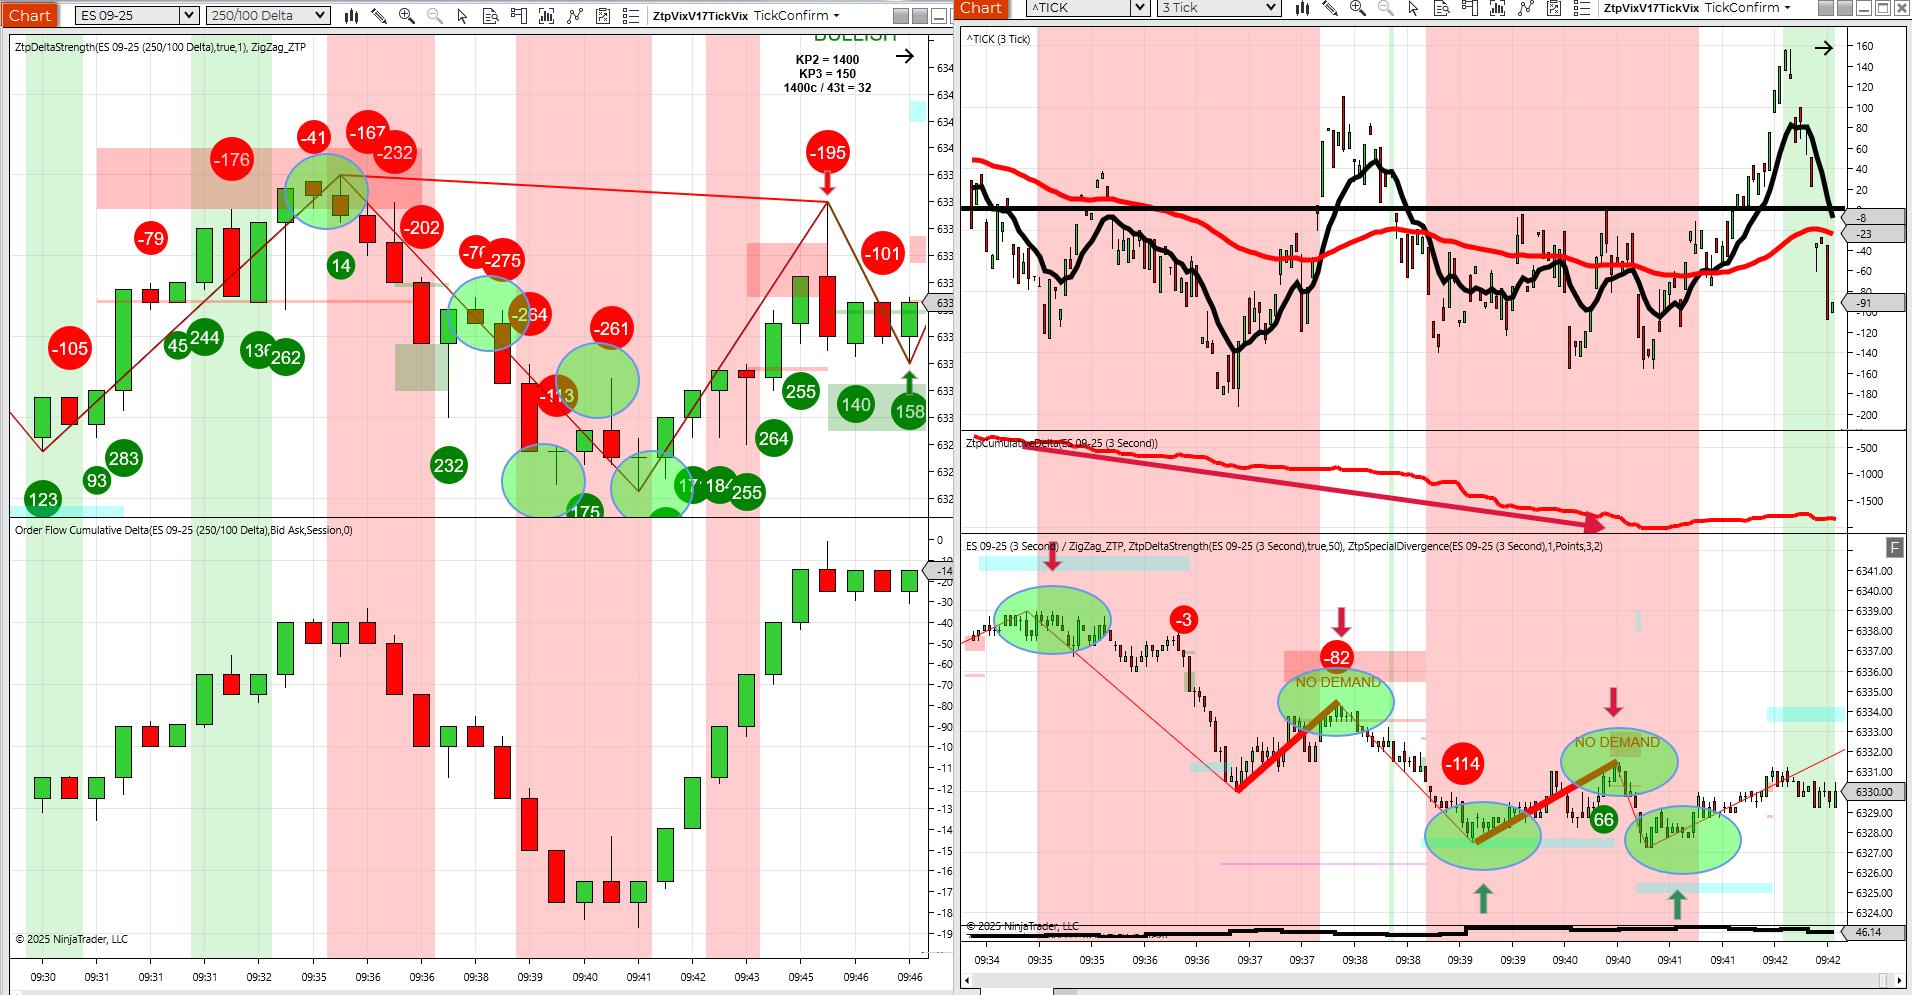
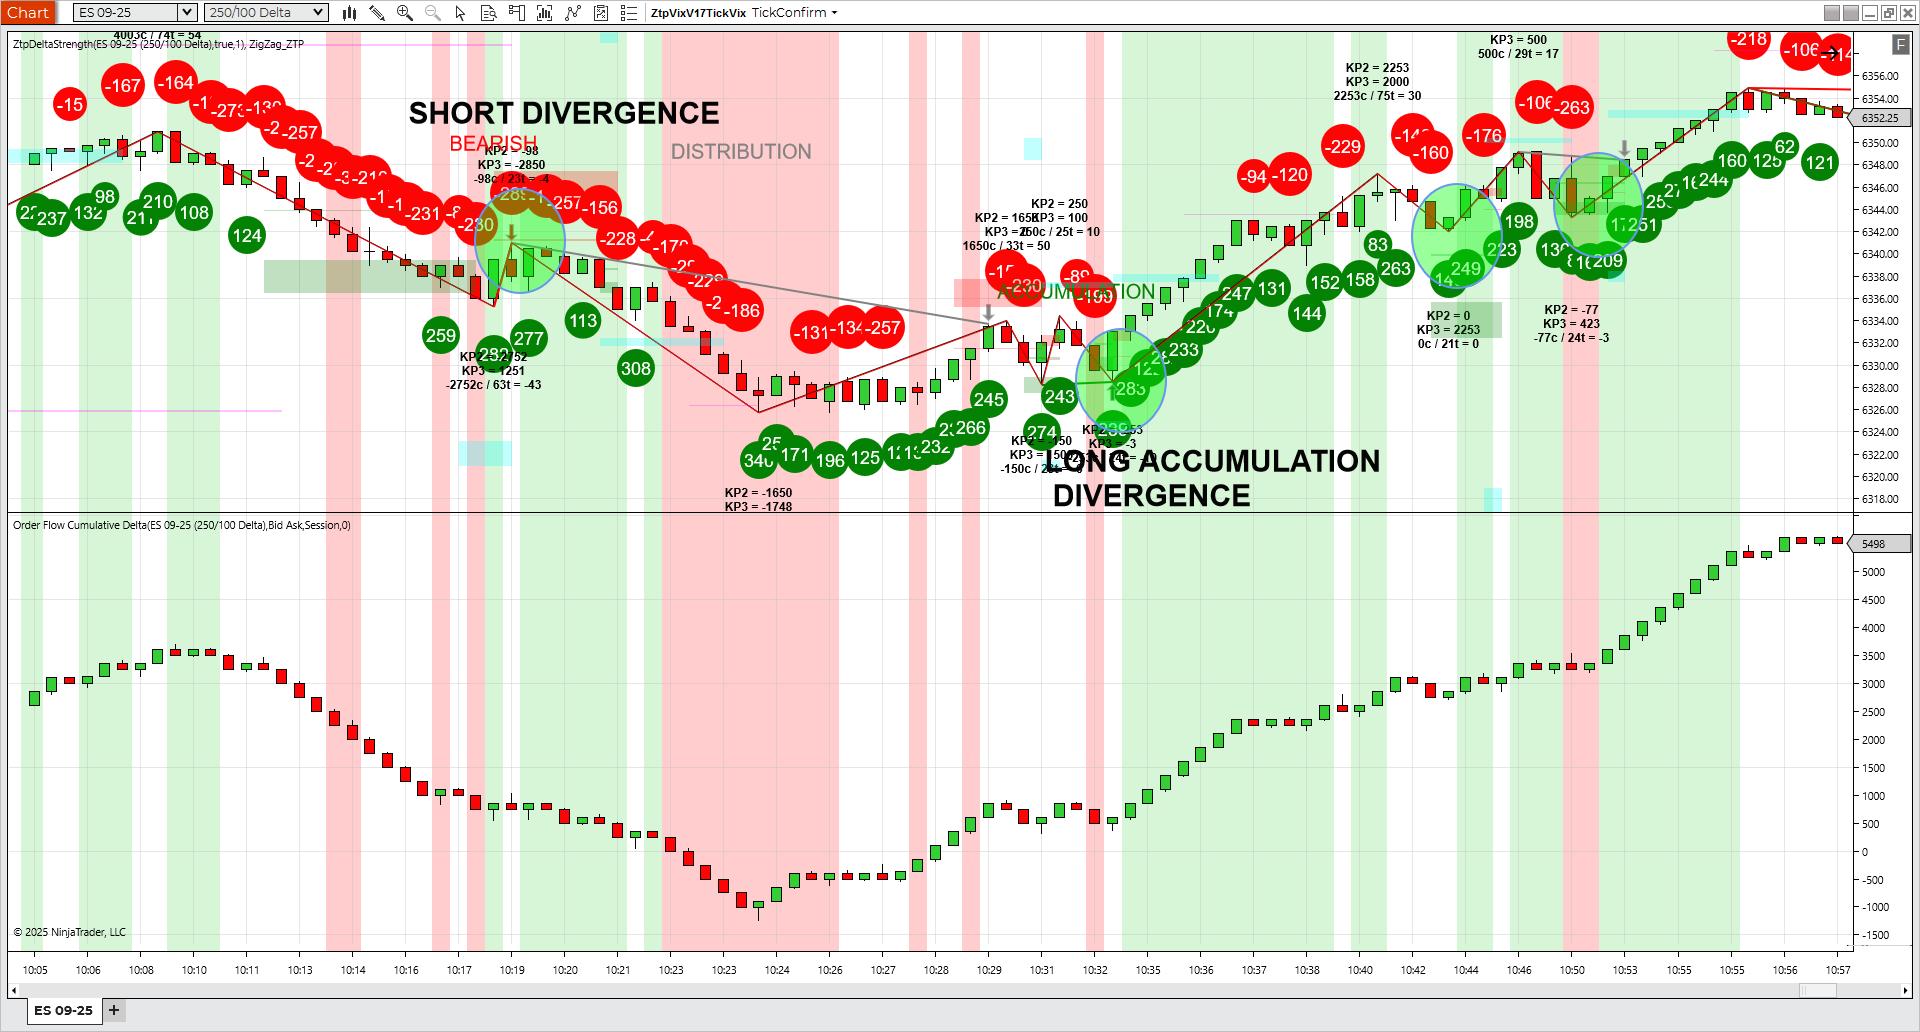
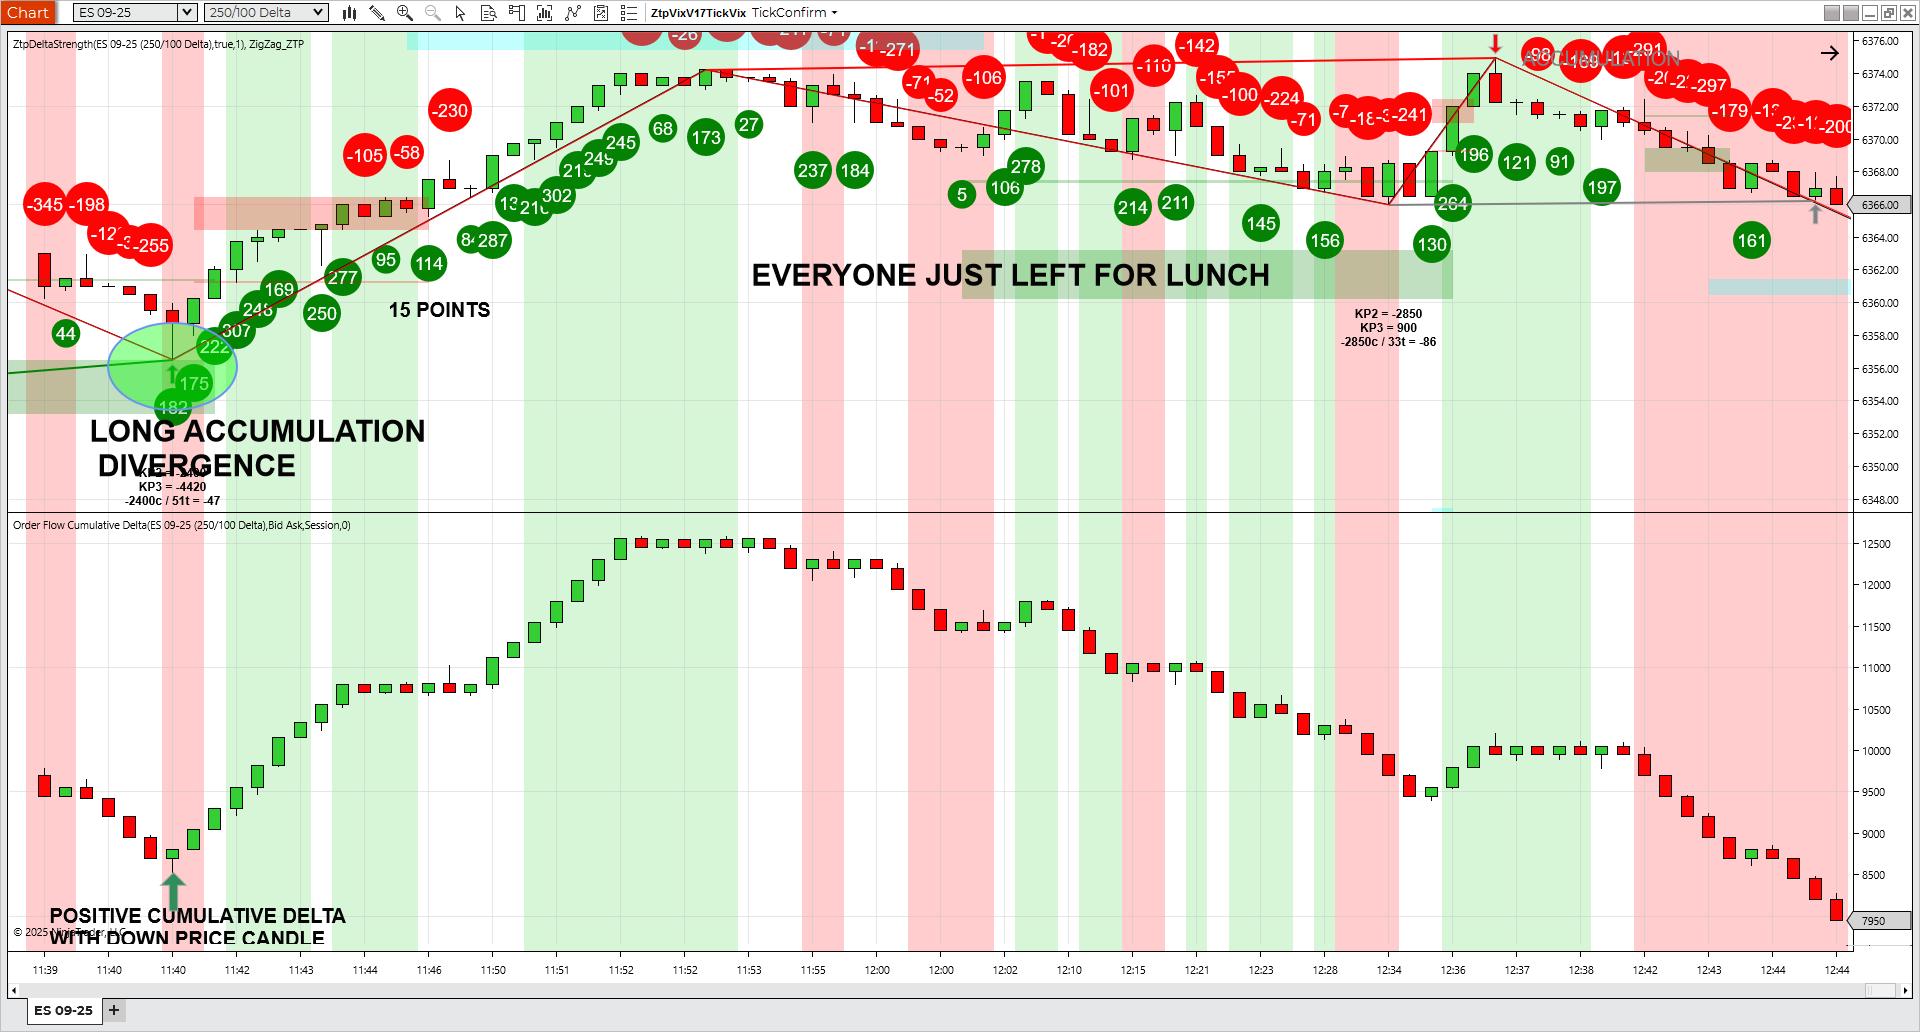
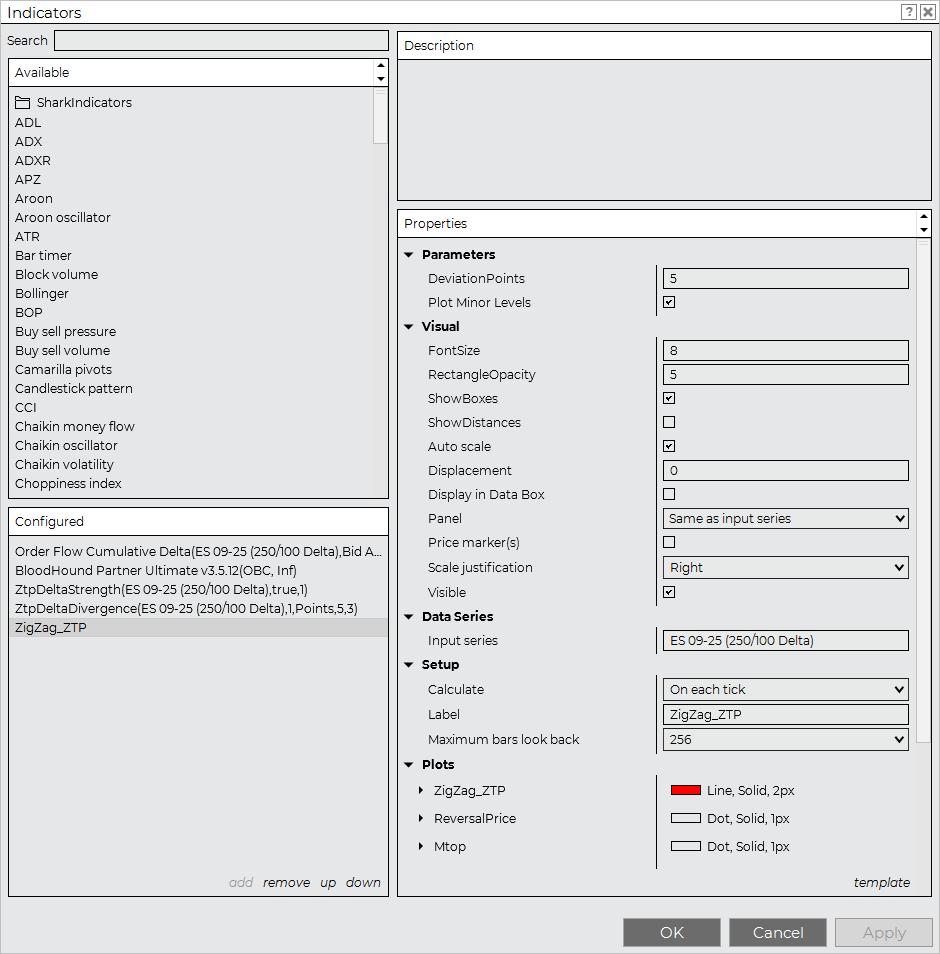
Series of trades from 8/6/25 at 0935 Trade Setup The morning of 8/6/25, right after the open, the new chart template had a set of 3 trades setup with 3 entries and exits. I have added the ZTP Zig Zag to the chart and there is something different. The zigzag in on this chart is […] The post Great Series of Trades using New Delta Chart appeared first on ZoneTraderPro.

The post Great Series of Trades using New Delta Chart appeared first on ZoneTraderPro.