
Should you assume 10% returns from the stock market - or something else - when projecting out your retirement plan?
Before the article, check out the latest on my podcast, Personal Finance for Long-Term Investors:
- On Apple Podcasts
- On Spotify
- On YouTube

Now, here’s today’s article:
Reader Lisa wrote in this week,
Jesse – my understanding is that both stock prices and stock valuations matter for long-term returns. So…with both pretty high like you mentioned last month, what are your returns expectations going forward?
Is it something different than 10% per year? That’s what I’m using in my spreadsheet.
Is there a “math-y” way to better find a % return number for the future?
Almost exactly a year ago, I wrote this post: What Long-Term Stock Returns Should I Assume For My Plan?
It’s a complicated answer, and I recommend you read that article.
I ended that article with this statement:
If I’m doing literal back-of-the-napkin math for someone, my go-to numbers are 9-10% for diversified stocks, 4-5% for diversified bonds, 3% for inflation. But I know the limits of such simple assumptions, and I know when not to use them.
I want to amend something. Specifically – I think my stock return assumptions of 9-10% per year were TOO OPTIMISTIC. I’ll tell you why today.
I want to dive deeper on valuation and the equity risk premium today and suggest some reasonable math-based models for including them into our forward-looking return assumptions.
These numbers matter because they trickle down into other areas of our financial planning. How much do we need to save for retirement? Should we invest in stocks or pay off debt? Etc. It’s all based on our assumed future returns.

To truly understand this topic, we need to define a few terms first:
- Real returns (vs. nominal returns)
- Valuation
- The equity risk premium
But First…The Usual Preamble
Before the good stuff, please know this:
- I’m not predicting the future.
- I don’t know how the stock market will actually perform.
- I don’t have a crystal ball.

Financial planning isn’t about predicting the future. It’s about preparing for it by narrowing the range of possible outcomes. Along the way, we make assumptions about the future, and then continually test, refine, and correct them as reality unfolds.
That’s all we’re doing today. Refining some assumptions.
Real Returns vs. Nominal Returns
Hopefully, you’ve heard these terms before, and this definition makes sense to you.
Real returns include the adverse effect of inflation, whereas nominal returns do not.
Some quick, easy math might show you that a 10% nominal return minus 3% inflation leads to a 7% real return.
Real returns are the metric of merit. Real returns explain how much your actual purchasing power has grown, or shrunk, over time.

Valuation
The term “valuation” refers to what investors are willing to pay for a company’s stock or for the market index as a whole. More specifically, it’s comparison between the price of a company/index and the fundamentals of that company/index. Fundamentals might include earnings, sales, or other hard accounting facts.
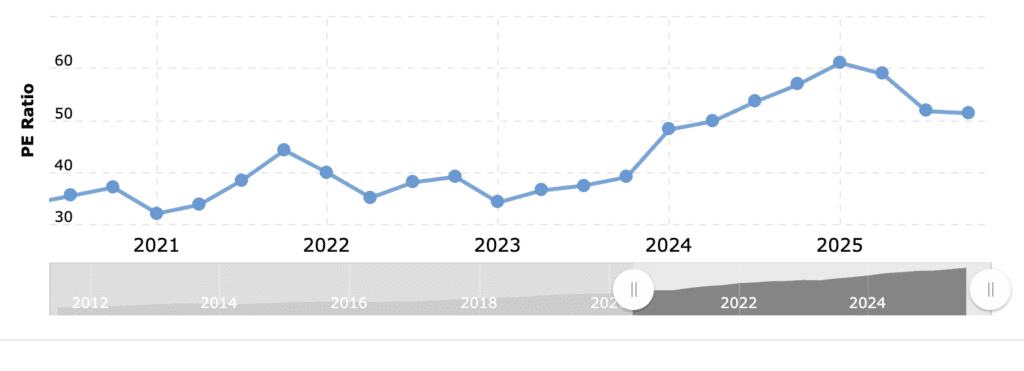
Let’s grab a $1.50 hot dog and look at Costco. Its stock price is up ~150% over the past 5 years on top of its small dividend. It has performed well!

But over that same 5-year period, Costco’s earnings only increased by ~71%.
The rest of that stock price increase is solely due to valuation expansion, or the fact that investors are paying more for Costco’s profits today than they were 5 years ago. A simple way of saying it: when we look under the hood, Costco is only 71% “better,” yet investors are paying 150% more for it.
Sure enough, we see Costco’s present-day price-to-earnings (P/E) ratio of ~51, as opposed to that same ratio 5 years ago of ~35.
Yes – P/E is sibling of the CAPE ratio, which you’ve heard me discuss before.
This “valuation expansion” occurs when investors anticipate stronger future growth, lower risk, or are simply swept up in optimism.
If a company is truly growing and/or decreasing the riskiness of its future profits, then valuation expansion is entirely logical. But the idea of being “swept up in optimism” cannot be ignored. We’ll come back to this idea.
One important takeaway: valuations cannot go up forever. Investors will not forever pay more and more and more for the same dollar of profit. Valuations can rise on hope for the future, but eventually that future must arrive, justify the hope, and bring the valuations back to normal levels.
You might think Oreos are fair at $4 a box, a bit overpriced at $5 a box, and outright expensive at $6 a box. But you’d never pay $20 a box unless they literally added 400% more cookies inside. Cookies are the fundamentals here. The price-to-cookie ratio cannot rise infinitely. Valuations cannot go up forever.
In fact, you could argue valuations act like a bungee cord. The further up they go, the more likely they are to later fall, and vice versa. The more valuations are based on future expectations, hopes, and optimism, the more likely it is that those lofty expectations will be unmet.

Quick sidenote…My free weekly newsletter helps busy professionals and retirees avoid costly mistakes and grow lasting wealth to and through retirement. Join 3900+ subscribers, for free.
The Equity Risk Premium
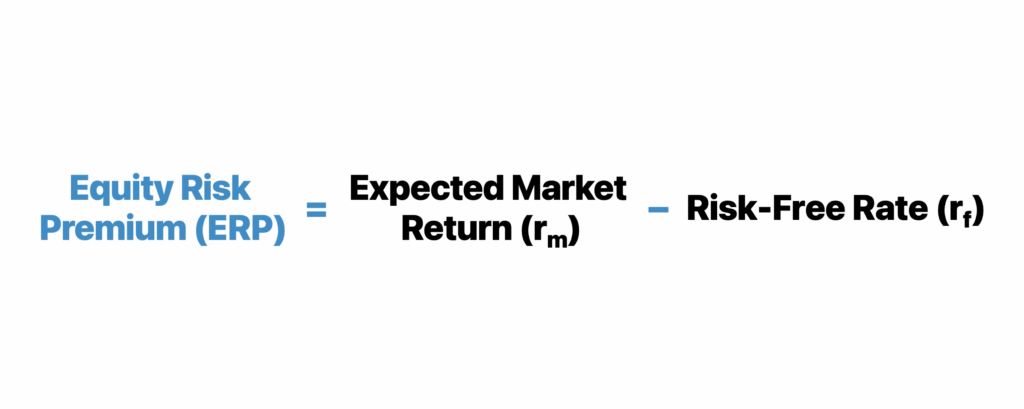
The connection between risk and reward is fundamental to all investors, and the equity risk premium (ERP) focuses on that idea.
The ERP represents the “extra” or “additional” return investors expect to earn from owning stocks compared to safer assets like Treasury bonds. We need to be paid for taking risk. We know stocks are volatile. To convince investors to bear that uncertainty, the stock market must offer a higher expected return.
In practice, the ERP is often measured as the difference between the expected return on a broad stock index (like the S&P 500) and the yield on risk-free government bonds. If investors expect stocks to return 10% annually and bonds yield 5%, the implied ERP is 5%.
The ERP shifts with earnings reports, inflation expectations, Federal Reserve pronouncements, and (perhaps most importantly) with perceived risk. When fear rises and stock valuations fall, the ERP widens (investors demand more reward for owning stocks). When optimism prevails and valuations rise, the ERP narrows.
Remember that vital fact: there’s an inverse relationship between valuations and the risk premium. When investors are willing to pay more for each dollar of earnings, they’re accepting a thinner reward for taking stock market risk. When valuations fall, that reward fattens up again.
In short, the equity risk premium is the “price of risk” in the stock market. It’s the compensation investors demand for stepping out of safe assets and into uncertain ones.
Bringing It All Together
It’s essential we first defined those terms above. They’ll help us understand “how we got here.”
And by “here,” I mean to the place where many DIY investors have “10% per year” as a starting point in their head for modeling future stock market returns.
In short – we got to 10% because that’s the nominal historic average for the U.S. stock market.
- Going back to 1871 through August 2025, the nominal average return of the U.S. stock market is 9.3% per year.
- …going back to 1926, when the “S&P 90” was first consistently tracked, the nominal average return is 10.4% per year
- …going back to 1950, when many people defined the start of the “post-WWII” market, the nominal average return is 11.5% per year.
This is where “stocks return 10% per year” comes from.

But Is That Data “Real”?
But these data points do not account for inflation,
(Side note – even some experts improperly account for inflation in retirement planning, and it’s essential to get it right).
If we accurately account for inflation in the 3 data points above, the long-term returns of the U.S. stock market drop to 7.1%, 7.2%, and 7.8% per year, respectively.
Even without digging deeper, we have already concluded that a 10% annual rate is not suitable for legitimate financial planning. The napkin-math shorthand becomes:
“10% nominal returns, minus 3% for inflation, equals 7% real returns.”
But I vote we carry on and go deeper.

Should We Care About Valuations and Market Returns?
In January 1950, the S&P 500’s P/E ratio was 7.2.
In September 2025, that P/E ratio was 29.7.
If you’re more of a CAPE person, then respective CAPE values were 10.9 and 40.6.
In either case, we see a 4x increase in valuation over the past 75 years.


Over that same period, the S&P 500 total real return was 7.7% per year, or a whopping 28096% or ~281x in total.
But here’s the vital question…how much of that 281x return is due to increased earnings vs. increased valuations?
Are there more cookies in the Oreo box? Or are we just paying more for the same old cookies?
Earnings are the reason we invest in stocks in the first place. Increased earnings equates to “we invested for the right reasons.” But valuations, as we determined before, cannot increase forever. Whatever role increased valuations have played before, we cannot and should not assume repeats in the future.
If we remove the effect of valuation expansion, the annual real return of the US stock market drops from 7.7% per year down to 6.2% per year. That’s the remainder based solely on earnings growth.
And why, again, do we remove valuation expansion? Because valuations cannot and will not go up forever. We cannot and should not depend on that aspect of price growth. The valuation expansion of 4.1x (29.7 / 7.2) between 1950 and 2025 will not be replicated between 2025 and 2100. Investors might pay a P/E of ~30 today, but they will not pay a P/E of ~120.
A P/E of 120 equates to an expected 0.83% earnings yield (1/120). You’re buying something that earns less than 1% per year based on current profits. It means you believe you’ve found the next Amazon circa 2009. Even if that logic applies to one or two needles in the market’s haystack, there’s no way it can apply to the whole market.
So we must take a step backward and say – without valuation expansion, the US stock market’s real return has been 6.2% per year since 1950.
But is the USA special?
If we look outside the USA, global real stock returns (ex-USA) dating back to 1900 are 4.4% per year. If we include US returns into that data, the annualized real return becomes 5.1%.

Should We Care About the Equity Risk Premium and Market Returns?
Aswath Damodaran knows a heckuva lot more about ERP than me.
He estimated the ERP around 4.0% in 2024. If we combine that with the current risk-free rate of 4.0%, and a long-term average inflation rate of 3%, then our future expected real returns become:
4% ERP + 4% risk-free rate – 3% inflation = 5% real returns.
The current equity risk premium, though built on assumptions, is implying a forward-looking 5% real return from stocks.
It’s Not 10%
What I’ve laid out explains why I don’t feel comfortable using 10% as our long-term stock return expectation anymore.
I used to that that. But I’ve changed my mind. And I don’t think I’m being irrationally fearful or harmfully conservative.
If we remove valuation expansion, which I believe is the correct thing to do, then we see long-term annual stock returns of ~8% nominally, or ~5% real. The equity risk premium supports that idea, too.
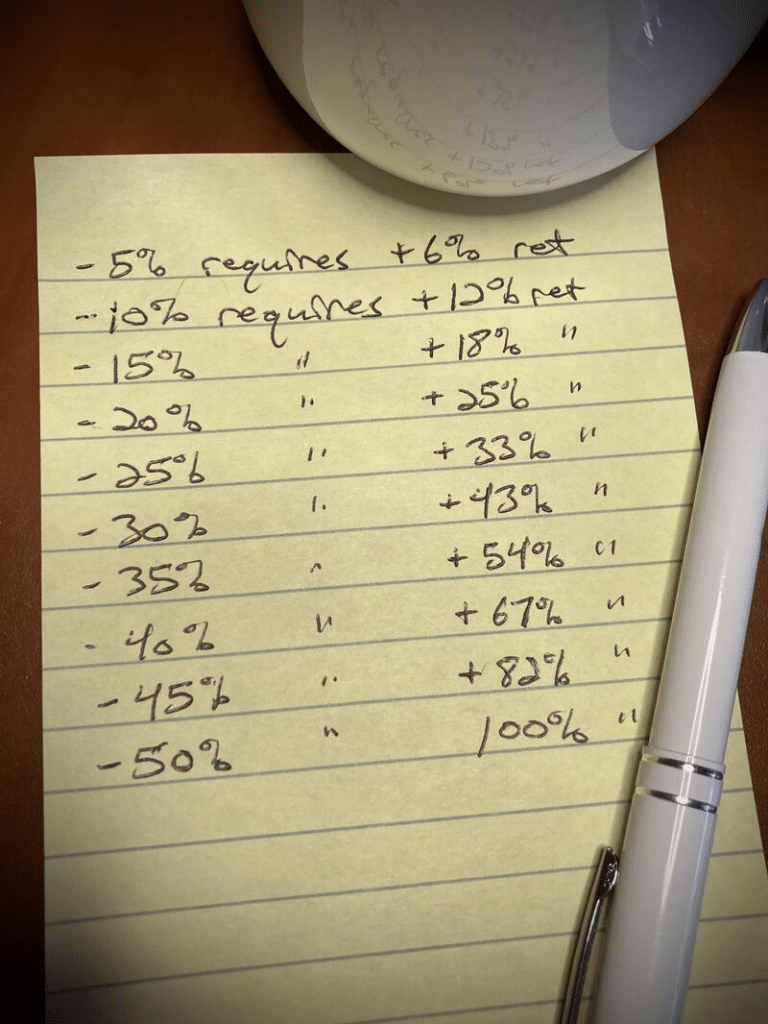
I know changing from 10% to 8%, or from 7% to 5%, is a little scary. When compounded over decades, the difference between 7% real returns and 5% real returns is huge.
7% for 30 years leads to ~660% increase in real wealth.
5% for 30 years leads to ~330% increase in real wealth.
That difference cannot be overstated. It’s half!!! It’s the kind of difference that leads to years of change in a fully fledged retirement plan.
But if we’re being realistic with ourselves, that’s my answer.
Over long periods of time, for the sake of planning:
5% per year real returns, 8% nominal returns.
Thank you for reading! Here are three quick notes for you:
First – If you enjoyed this article, join 1000’s of subscribers who read Jesse’s free weekly email, where he send you links to the smartest financial content I find online every week. 100% free, unsubscribe anytime.
Second – Jesse’s podcast “Personal Finance for Long-Term Investors” has grown ~10x over the past couple years, now helping ~10,000 people per month. Tune in and check it out.
Last – Jesse works full-time for a fiduciary wealth management firm in Upstate NY. Jesse and his colleagues help families solve the expensive problems he writes and podcasts about. Schedule a free call with Jesse to see if you’re a good fit for his practice.
We’ll talk to you soon!